A Valuation Warning Wall Street Can't Ignore: The S&P 500 at a 45-Year Extreme
The S&P 500's forward P/E ratio just hit 24x, a valuation level only seen twice before since 1980. Here's what the historical data reveals about what happens next when markets enter this territory.
Key Takeaways
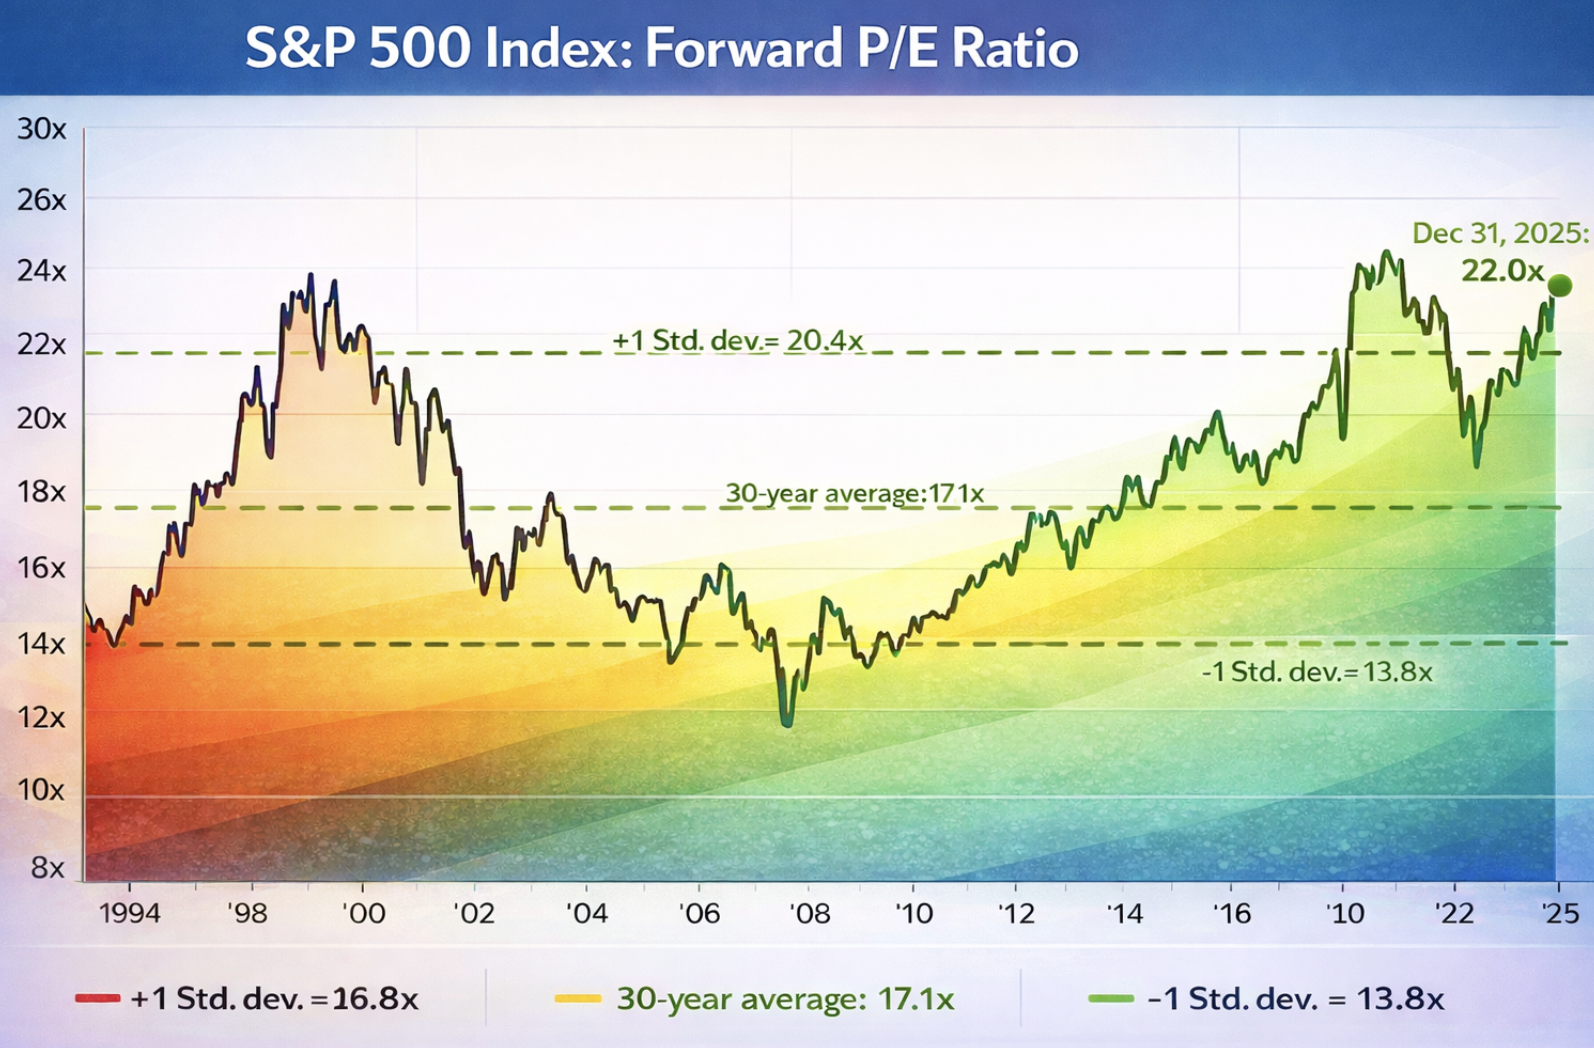
- The S&P 500's forward P/E ratio sits at 24x, a level only reached twice before since 1980: the dot-com peak (24.4x in March 2000) and COVID recovery (23.6x in August 2020). Both were followed by significant market corrections.
- At 2.3 standard deviations above the 25-year average of 16.75x, even a return to normal valuations means a 30% drawdown with zero earnings decline. Layer in a recession, and you're looking at 45-55% peak-to-trough losses.
- Historical data shows that when forward P/E exceeds 23x, subsequent 10-year returns have been negative every single time. You're paying a significant premium for optimism with almost no margin for error.
The S&P 500's forward price-to-earnings ratio sits at roughly 24x today. That number should make you pause.
We've only crossed the 23x threshold twice before in the past 45 years: during the dot-com bubble peak in 2000, and briefly in August 2020 during the COVID recovery. Now we're here again. Each time carried its own narrative about why "this time is different." The data suggests we should be skeptical.
Where We Stand: The Numbers Don't Lie
The 25-year average forward P/E for the S&P 500 is 16.75. The typical range runs between 13.45 (one standard deviation below) and 20.04 (one standard deviation above). At 24x, we're sitting 2.3 standard deviations above the historical mean.
To put that in perspective: we're not just expensive. We're in the statistical tail of expensive.
Here's the journey over the past two decades:
2004-2007: The pre-crisis bull market kept valuations relatively restrained at 15-18x. Even at the peak in October 2007, we topped out around 18x. High, but nothing like today. This was well after the dot-com bubble had peaked at 24.4x in March 2000.
2008-2009: The financial crisis crushed multiples to 10-12x as earnings collapsed and apocalypse scenarios dominated headlines. Classic capitulation.
2010-2019: The recovery and expansion years saw valuations normalize to 14-17x for most of the period. This was sustainable growth backed by earnings, not just multiple expansion.
2020-2021: COVID changed everything. The Fed slashed rates to zero, opened the liquidity floodgates, and forward P/E exploded to 23.6x in August 2020. That was the first time we'd crossed 23x since the dot-com bubble. Money was free, and the market priced accordingly.
2022: Reality check. The Fed hiked rates aggressively to fight inflation, and by October 2022, forward P/E had compressed back to 15x. Right at the long-term average. The market bottomed, and value hunters had their moment.
2023-2025: The AI boom. In just three years, we've expanded from 15x to 24x. That's a 60% increase in what investors are willing to pay for each dollar of forward earnings, while actual earnings growth has been solid but nowhere near 60%.
The Two Times We've Been Here Before
When forward P/E crosses 23x, history hasn't been kind to what comes next. We've only seen this twice before since 1980.
Dot-com bubble (1999-2000): Valuations hit stratospheric levels as everyone believed the internet would change everything overnight. Forward P/E peaked at 24.4x in March 2000. It did change everything, just not fast enough to justify those multiples. The subsequent decade delivered negative total returns. The S&P 500 took 13 years just to break even from its 2000 peak.
COVID recovery (August 2020): Emergency monetary policy and fiscal stimulus pushed valuations to 23.6x. The difference? The Fed kept rates near zero and maintained QE. When they finally started tightening in 2022, we got a 25% drawdown despite earnings holding up relatively well.
Today (2025): The AI narrative has convinced markets that we're on the cusp of a productivity revolution that will drive earnings growth for years. Maybe we are. But are we pricing in a best-case scenario that leaves no room for disappointment?
What Makes This Time "Different"
Every bubble has its justification. The bulls will tell you this time it actually is different because:
- AI is real: Unlike the dot-com era's vaporware, AI is generating actual revenue and productivity gains today
- Mega-cap dominance: The top 7 companies are growing earnings faster than the broader market
- Fed pivot incoming: Rate cuts should support higher multiples
- No recession in sight: Economic resilience has defied the bears repeatedly
These aren't bad arguments. AI is transformative. The Magnificent 7 do have real moats and cash flow. The economy has stayed strong.
But here's what the bulls aren't pricing in: mean reversion is a feature of markets, not a bug.
The Math of Mean Reversion
Let's run the numbers on what happens if valuations simply normalize. Not crash, just return to historically normal levels.
Scenario 1 - Return to +1 Standard Deviation (20x):
From 24x to 20x = 16.7% drawdown with zero earnings decline
Scenario 2 - Return to Long-Term Average (16.75x):
From 24x to 16.75x = 30.2% drawdown with zero earnings decline
Scenario 3 - Recession + Multiple Compression (13.5x):
From 24x to 13.5x = 43.8% drawdown with zero earnings decline
Now layer in what happens if a recession actually does materialize and earnings decline by 10-15%. You're looking at potential peak-to-trough declines in the 45-55% range. Similar to what we saw in 2008.
Is that guaranteed? No. But the math shows you have almost no margin of safety at current valuations.
What Historical Data Shows About Returns
According to research from Yardeni Research, when forward P/E exceeds 23x, subsequent 10-year annualized returns for the S&P 500 have been negative in every historical instance.
Let that sink in. Every. Single. Time.
The "lost decade" of 2000-2010 is the poster child. Despite two major bull markets within that period, investors who bought at dot-com peak valuations were underwater a full decade later. The culprit wasn't just the crashes. It was starting from an elevated multiple that took years to work off.
Current Market Valuation data shows that at 24x forward P/E, the market is pricing in either:
- Sustained earnings growth of 15%+ annually for the next decade, or
- Permanently higher valuation multiples justified by perpetually low rates and high growth
Both assumptions are aggressive. One might be wrong. Both being right simultaneously is a long-shot bet.
What This Means for Your Portfolio
If you're a long-term buy-and-hold investor with decades ahead of you, short-term valuation doesn't matter much. Time in the market beats timing the market, and all that. Dollar-cost averaging through volatile periods has historically worked.
But if you're closer to retirement, managing a significant portfolio, or thinking about major allocation decisions, these valuations should inform your thinking:
Reality check #1: Your expected returns are probably lower than you think. If multiples mean-revert over the next 5-10 years, even strong earnings growth might not save you from mediocre returns.
Reality check #2: The next bear market has more room to fall. Every previous bear market from elevated multiples has seen 40-50% drawdowns. The 2022 correction was relatively mild at 25% precisely because we started from more reasonable valuations.
Reality check #3: International markets and sectors trading at lower multiples might offer better risk/reward. Boring is beautiful when U.S. growth stocks are priced for perfection.
The Bottom Line
We're not calling for an imminent crash. Markets can stay expensive longer than you can stay solvent betting against them. The AI boom might deliver the productivity gains needed to grow into these valuations over time.
But the data is clear: at 24x forward P/E, you're paying a significant premium for optimism with very little room for error.
The last time we were here in August 2020, the Fed was printing money and rates were at zero. That safety net is gone. The time before that was the dot-com bubble, and we all know how that ended.
Smart investors don't ignore history. They respect it, understand the context, and adjust their expectations accordingly. At current valuations, the market is priced for a goldilocks scenario: strong earnings growth, no recession, controlled inflation, and rate cuts at just the right pace.
What happens when even one of those assumptions breaks? That's the question your portfolio should be prepared to answer.
The data and analysis in this article are for informational purposes only and should not be considered investment advice. Markets are inherently uncertain, and past performance does not guarantee future results. WallStSmart provides institutional-grade research tools for retail investors to make informed decisions.
Recent Articles(9)
View AllWho Is Buying SpaceX at a $1.7 Trillion Valuation?
SpaceX is about to complete the largest IPO in history at a $1.7 trillion valuation, but a sum-of-the-parts analysis puts the company's intrinsic value closer to $350 to $780 billion. Here's why Starlink carries the entire business, why the price is really an AI bet, and what value investors should make of it.
NVTS Forecast 2030: Why Navitas Semiconductor Could Hit $500M (Or More)
Navitas Semiconductor (NVTS) generated $45.9 million in 2025 revenue while management targets a $3.5 billion serviceable market by 2030. Here's a probability-weighted look at where NVTS annual revenue could actually land in 2030, and why the stock has rallied nearly 1,000% in a year.

Will NVIDIA Stock Hit $300 in 2026? A Probability-Weighted Forecast
Can NVIDIA stock reach $300 by end of 2026? Three Wall Street banks say yes, with BofA at $320 and Tigress at $360. Here's the probability-weighted breakdown ahead of NVDA's Q1 FY2027 earnings on May 20.
Trump Just Disclosed Up to $750M in Q1 Stock Trades. The AI Infrastructure Pattern Is Hard to Ignore
President Trump disclosed more than 3,700 securities transactions worth up to $750 million in Q1 2026, with several buys landing one to two weeks before favorable regulatory decisions in those exact names. Here's what the AI infrastructure pattern signals for retail investors and where the second-derivative trade lives.
How to Track Smart Money: A Free Tool for Following Institutional Investors
Track 67 of the most-followed institutional investors managing $1.11 trillion in equities through SEC 13F filings. Our new free Superinvestor Tracker lets retail investors compare hedge fund and asset manager portfolios side by side without paying for a Bloomberg terminal.
Which Stock Will Be the First $6 Trillion Company?
Nvidia just closed at a $5.05 trillion market cap. Alphabet is hot on its heels at $4.80 trillion. The race to be the first $6 trillion company is closer than most retail investors realize, but the math still favors one name. Here is the realistic breakdown of who gets there first in 2026 and why.
RAM Prices Are Exploding: Inside the Great Memory Squeeze Wall Street Underestimated
DRAM contract prices surged 55-60% QoQ as AI demand permanently rewired the global memory market. Here are the top 10 memory makers by market share, which stocks win from the supercycle, and why server OEMs like Dell and HP are getting margin-crushed.
CoreWeave Just Locked In Meta and Anthropic in 48 Hours. Is CRWV a Buy in 2026?
CoreWeave locked in $21B from Meta and a multi-year Anthropic deal in 48 hours, pushing backlog to $87.8B. Is CRWV stock a buy in 2026? Here is the probability-weighted take.
How the Iran War Quietly Became the Biggest Threat to AI Infrastructure Stocks
The Iran war wasn't just an oil story, it was a stress test for AI infrastructure stocks. Here's how IREN, CoreWeave, Nebius, and Nvidia are really exposed to energy cost shocks, and which names look best positioned after the ceasefire.
About WSS Team
WallStSmart editorial team delivering professional financial analysis and market insights.
Follow on Twitter