Oil at $100 Is Coming: What the Iran War Means for Energy Stocks Right Now
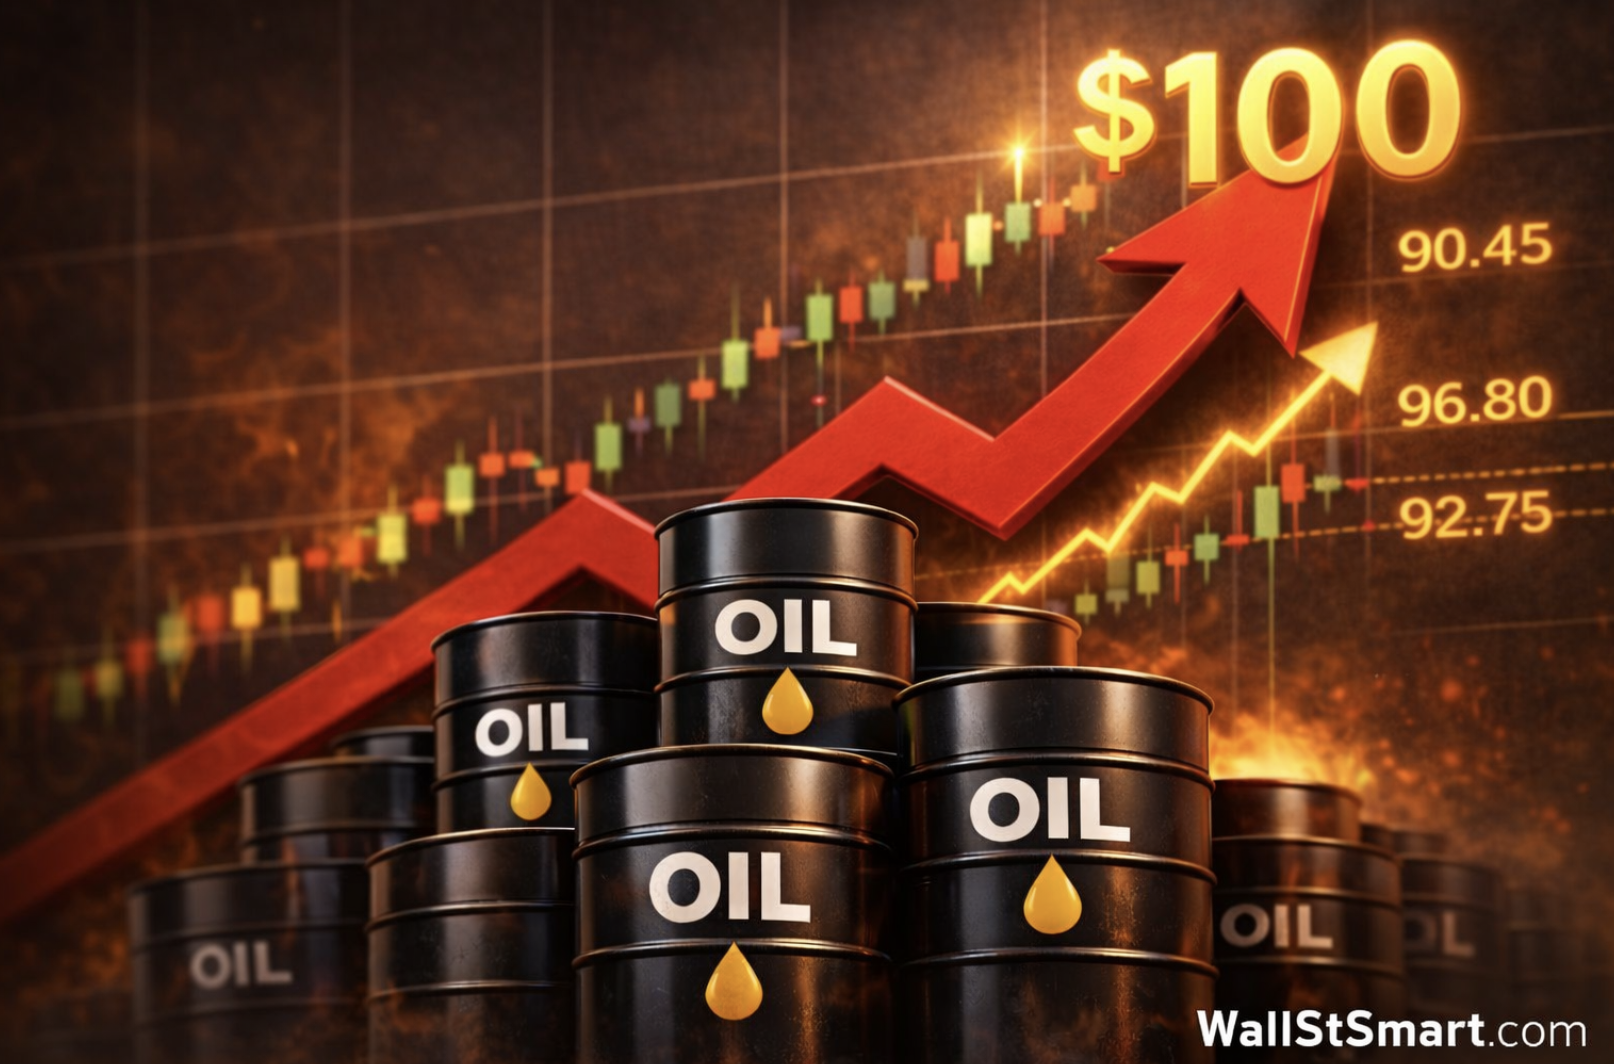
WTI crude just posted its biggest weekly gain in futures trading history, settling at $90.90 as the Iran war shuts down the Strait of Hormuz. Here is what it means for oil prices, energy stocks like XOM, CVX, COP, and OXY, and how investors should be thinking about positioning right now.
Key Takeaways
- WTI crude surged 35% this week as Hormuz shipping halted completely
- U.S. Permian producers XOM and CVX are insulated from Middle East disruption
- $100 oil is now the base case if the Iran conflict prolongs
U.S. crude oil just posted its biggest weekly gain in the history of futures trading. Not the biggest gain of the year or of the decade. The biggest ever, going back to 1983. That is the market telling you something serious is happening.
As of Friday's close, West Texas Intermediate settled at $90.90 per barrel, up 35.63% for the week. Brent crude finished at $92.69, up roughly 28%. The catalyst is the U.S.-Israel war with Iran, now in its seventh day, and the near-total shutdown of the Strait of Hormuz, the narrow waterway through which approximately 20% of the world's daily oil supply normally flows. The global energy market has not faced a disruption of this magnitude since the 1970s oil embargo, and investors need to understand both the near-term risks and where the real opportunities are sitting right now.
Why the Strait of Hormuz Shutdown Changes Everything
The Strait of Hormuz is not just an oil chokepoint. It is the chokepoint. About 20 million barrels of crude oil and petroleum products move through it every day under normal conditions. As of Friday, JPMorgan's commodities team noted that commercial traffic through the Strait remained virtually nonexistent on day six of the conflict, with the market shifting from pricing pure geopolitical risk to grappling with tangible operational disruption.
That is a material distinction. In past Middle East flare-ups, oil prices typically spiked on fear and then retreated when actual supply disruptions proved limited. This time, the disruption is real and documented. Iranian drones and missiles have struck fuel storage facilities at the UAE's Port of Fujairah and Oman's port of Duqm. Saudi Arabia's Ras Tanura refinery was hit on Monday and subsequently shut down. Most significantly, QatarEnergy halted all activity at the world's largest liquefied natural gas export facility after it was struck by drones. Qatar accounts for roughly 20% of global LNG supply.
Hundreds of tankers are now sitting off the Iranian coast unable to transit to global markets. Kuwait has reportedly begun cutting production at some oil fields after running out of storage capacity for crude it cannot ship. The supply disruption is not hypothetical anymore — it is showing up in barrels that are not moving.
Is Oil Going to $100 a Barrel? What the Data Actually Shows
Qatar's energy minister told the Financial Times that Gulf exporters could halt production within days if tankers cannot pass the Strait, warning that prices could spike to $150 per barrel and bring severe economic consequences globally. That is an extreme scenario, but mainstream institutional analysts are not far behind.
Bank of America's commodity strategist Francisco Blanch has outlined a framework where Brent surges above $100 if Iran continues attacking neighboring energy infrastructure, with a prolonged Strait disruption adding $40 to $80 per barrel on top of current prices. Deutsche Bank's research desk has flagged that Brent could surge toward $200 in a scenario where Iran successfully enforces a full Strait closure using mines and anti-ship missiles.
Translating those scenarios into probabilities: $100 Brent in the near term now looks like the base case, not the bull case. The last time oil hit $100 was after Russia invaded Ukraine in 2022, and even that disruption did not shut down a critical global shipping lane. A sustained closure of the Strait lasting more than three weeks would exhaust Gulf storage capacity and force production shutdowns across the region, which is a supply shock with no modern precedent.
For U.S. consumers, the pump impact is already underway. National average gasoline prices rose to $3.25 per gallon this week, up from $2.98 a week ago, with analysts warning of an additional 10 to 30 cents per gallon increase over the coming days.
Which Energy Stocks Benefit Most From Rising Oil Prices in 2026
The most important thing to understand about this rally is that it is not just a short-term war trade. As Bloomberg's coverage of the Hormuz disruption makes clear, this conflict is accelerating a structural repricing of geopolitical distance, with the market aggressively rewarding companies whose production never needs to travel through a disputed waterway. U.S. Permian Basin producers are the clearest beneficiaries. The breakdown by company:
ExxonMobil (XOM) is trading around $155, up roughly 28% year-to-date. The Pioneer Natural Resources acquisition transformed Exxon into the dominant Permian operator, with over 1.4 million net acres and a production breakeven around $35 per barrel in the basin. At $90 WTI, the free cash flow math is exceptional. Exxon delivered $28.8 billion in earnings and $52 billion in operating cash flow in 2025, and those figures scale upward sharply with every dollar of oil price increase above breakeven. The company has also committed to $20 billion in buybacks for 2026 and a dividend yield near 2.7%. Wells Fargo recently raised its price target from $156 to $183, citing Permian and Guyana upside. This is the broadest, most diversified energy play in the sector.
Chevron (CVX) has surged roughly 23% year-to-date, touching $196.76 intraday at its 52-week high. Chevron's dividend and capex breakeven sits around $50 per barrel Brent, which means at $92 Brent, the company is generating free cash flow well beyond what it needs to cover shareholder returns. The company raised its dividend for the 39th consecutive year, now at $1.78 per quarter, with a yield around 3.7%. Bank of America raised their price target to $206, calling Chevron's Permian footprint a structural advantage in a world where Middle Eastern supply routes are unreliable. The $53 billion Hess acquisition also delivers a 30% stake in Guyana's Stabroek block, one of the highest-quality oil assets discovered in decades.
ConocoPhillips (COP) is up roughly 24% year-to-date, trading around $118. COP is the purest upstream play among the major producers, with no refining, no retail, and no downstream complexity. Goldman Sachs recently added COP to its U.S. Conviction Buy List, calling the company on the cusp of a significant re-rating. At current oil prices, ConocoPhillips generates approximately $7 in EPS, putting the stock at under 17 times earnings for a company that has become more operationally efficient every year since the Marathon Oil integration. Its pre-dividend free cash flow breakeven sits in the mid-$40s per barrel, so at $90 WTI, COP is generating substantial cash. The upcoming Willow project in Alaska adds another $4 billion in annual free cash flow by 2029.
Occidental Petroleum (OXY) is up roughly 30% year-to-date, trading around $54. It is the highest-torque name in this group, more operationally leveraged to oil prices than the supermajors, which cuts both ways but is clearly working in the current environment. Warren Buffett's Berkshire Hathaway owns approximately 28% of OXY, a level of institutional conviction that is worth noting. OXY completed meaningful debt reduction in January 2026, improving its balance sheet profile heading into this supply disruption.
The Stocks Getting Hurt, and Why It Matters
Not every sector benefits when oil prices spike. Airline stocks took a hard hit this week, since jet fuel is their largest operating cost. American Airlines (AAL) fell more than 4%, while United Airlines (UAL) dropped over 3%. Cruise lines sold off sharply as well. More broadly, the S&P 500 fell over 1% on Friday, the Dow slid 475 points, and the Nasdaq dropped 1.1%, compounded by a grim jobs report showing the economy shed 92,000 jobs in February.
Higher oil prices are fundamentally inflationary, and oil sustained near $100 or above would complicate the Fed's path considerably. This is the scenario where energy stocks work and most other equities face headwinds, a rotation that looks like it has significantly more room to run if the conflict prolongs.
How Should Investors Position in Oil Stocks Right Now
The conflict's duration is unknowable, which makes sizing positions carefully the priority. That said, the risk-reward for U.S. Permian producers is genuinely compelling even if oil pulls back from current levels. XOM's breakeven of $35 per barrel and CVX's breakeven of $50 per barrel means both companies generate exceptional free cash flow across almost any realistic oil price scenario. You do not need $100 oil to be sustained indefinitely for these stocks to work.
For investors who want sector-level exposure without picking individual names, the Energy Select Sector SPDR ETF (XLE) provides broad coverage across U.S. producers. Defense stocks like Lockheed Martin (LMT) have also benefited, surging approximately 15% since the conflict began, as active military operations accelerate munitions and equipment demand.
The setup in energy is as clear as it has been in years: physical supply is disrupted, Permian Basin producers are insulated from that disruption, and the market is actively rewarding domestic production capacity at a premium. As CNBC reported, WTI just posted its biggest weekly gain in futures trading history. The market is not overreacting — it is catching up to a supply reality that changed very quickly.
Disclaimer: This article is for informational purposes only and should not be considered financial advice. Stock investing involves significant risk, including potential loss of principal. Always conduct your own research and consult with a qualified financial advisor before making investment decisions.
Recent Articles(9)
View AllWho Is Buying SpaceX at a $1.7 Trillion Valuation?
SpaceX is about to complete the largest IPO in history at a $1.7 trillion valuation, but a sum-of-the-parts analysis puts the company's intrinsic value closer to $350 to $780 billion. Here's why Starlink carries the entire business, why the price is really an AI bet, and what value investors should make of it.
NVTS Forecast 2030: Why Navitas Semiconductor Could Hit $500M (Or More)
Navitas Semiconductor (NVTS) generated $45.9 million in 2025 revenue while management targets a $3.5 billion serviceable market by 2030. Here's a probability-weighted look at where NVTS annual revenue could actually land in 2030, and why the stock has rallied nearly 1,000% in a year.

Will NVIDIA Stock Hit $300 in 2026? A Probability-Weighted Forecast
Can NVIDIA stock reach $300 by end of 2026? Three Wall Street banks say yes, with BofA at $320 and Tigress at $360. Here's the probability-weighted breakdown ahead of NVDA's Q1 FY2027 earnings on May 20.
Trump Just Disclosed Up to $750M in Q1 Stock Trades. The AI Infrastructure Pattern Is Hard to Ignore
President Trump disclosed more than 3,700 securities transactions worth up to $750 million in Q1 2026, with several buys landing one to two weeks before favorable regulatory decisions in those exact names. Here's what the AI infrastructure pattern signals for retail investors and where the second-derivative trade lives.
How to Track Smart Money: A Free Tool for Following Institutional Investors
Track 67 of the most-followed institutional investors managing $1.11 trillion in equities through SEC 13F filings. Our new free Superinvestor Tracker lets retail investors compare hedge fund and asset manager portfolios side by side without paying for a Bloomberg terminal.
Which Stock Will Be the First $6 Trillion Company?
Nvidia just closed at a $5.05 trillion market cap. Alphabet is hot on its heels at $4.80 trillion. The race to be the first $6 trillion company is closer than most retail investors realize, but the math still favors one name. Here is the realistic breakdown of who gets there first in 2026 and why.
RAM Prices Are Exploding: Inside the Great Memory Squeeze Wall Street Underestimated
DRAM contract prices surged 55-60% QoQ as AI demand permanently rewired the global memory market. Here are the top 10 memory makers by market share, which stocks win from the supercycle, and why server OEMs like Dell and HP are getting margin-crushed.
CoreWeave Just Locked In Meta and Anthropic in 48 Hours. Is CRWV a Buy in 2026?
CoreWeave locked in $21B from Meta and a multi-year Anthropic deal in 48 hours, pushing backlog to $87.8B. Is CRWV stock a buy in 2026? Here is the probability-weighted take.
How the Iran War Quietly Became the Biggest Threat to AI Infrastructure Stocks
The Iran war wasn't just an oil story, it was a stress test for AI infrastructure stocks. Here's how IREN, CoreWeave, Nebius, and Nvidia are really exposed to energy cost shocks, and which names look best positioned after the ceasefire.
About WSS Team
WallStSmart editorial team delivering professional financial analysis and market insights.
Follow on Twitter