Markets React to Escalating Trade Tensions
Markets dropped 2.1% on Tuesday in the worst selloff since October as Trump's Greenland tariff threats triggered a flight to safety. Gold and silver hit record highs while natural gas surged 25%, revealing how geopolitical risk is reshaping asset flows across equities, commodities, and defensive sectors.
Key Takeaways
- Markets fell 2.1% as Trump's tariff threats triggered fear trade into gold and silver.
- Natural gas surged 25% on Arctic weather while defensive sectors gained momentum.
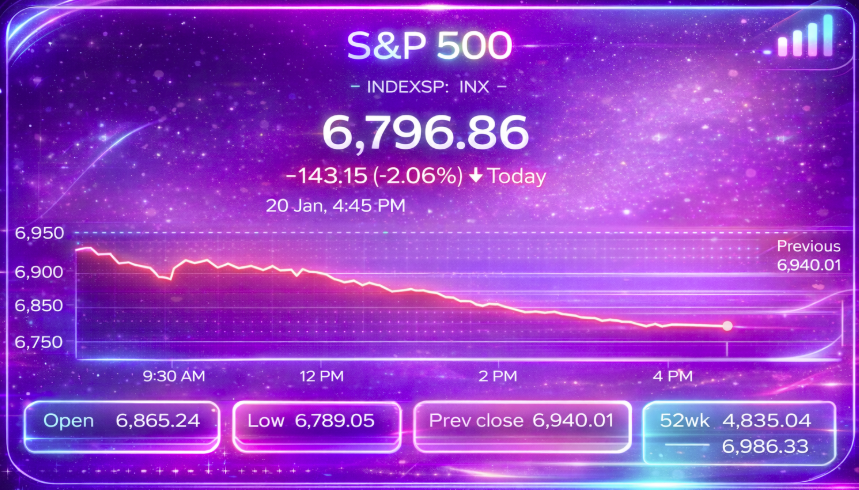
Tuesday delivered one of those trading sessions that reminds everyone why risk management matters. The S&P 500 closed down 2.1% at 6,796.86, marking its worst day since October. The Dow Jones shed 870 points, while the Nasdaq took an even harder hit with a 2.4% decline. When the dust settled, $1.2 trillion in market value had vanished in a single session, according to NBC News.
The catalyst was President Trump's weekend escalation over Greenland. He threatened 10% tariffs starting February 1 on eight European countries—including Denmark, Germany, France, and the UK—unless they support his acquisition plan for the Danish territory. Those tariffs would jump to 25% in June without a deal. Markets had been pricing in political noise all year, but this particular move caught investors off guard because it directly targets major NATO allies and threatens to disrupt critical trade relationships.
Fear Spreads Across Asset Classes
The market's fear gauge, the VIX, surged nearly 10% on Tuesday to reach 20.71. That level matters because it represents a clear break above the calm conditions we'd seen for weeks. When the VIX moves this aggressively, it signals that traders are paying up for portfolio insurance, which creates a feedback loop of selling pressure.
The most obvious beneficiaries of this fear trade have been precious metals. Gold pushed above $4,870 per ounce on Wednesday, setting fresh all-time records after Tuesday's strong gains. Silver performed even more impressively, trading around $95 per ounce and extending a rally that has seen the metal surge more than 150% over the past year, according to data from Trading Economics.
What makes this precious metals rally particularly significant is the simultaneous weakness in the U.S. dollar. During Trump's first tariff war, the dollar experienced substantial declines as global investors questioned America's reliability as a trading partner. We're seeing that pattern repeat itself now. A weaker dollar makes gold and silver more attractive to international buyers, creating additional upward momentum for metals prices. Mining companies like Newmont and Barrick Gold are positioned to benefit directly from these elevated precious metals prices.
The Natural Gas Explosion Nobody Saw Coming
While precious metals grabbed headlines, natural gas staged one of its most dramatic moves in recent memory. Prices rocketed 20.69% higher on Tuesday alone, reaching $4.72 per MMBtu, according to Trading Economics. From Friday's close through Tuesday, the commodity surged roughly 25% in what amounts to a true squeeze situation.
The immediate driver is an Arctic blast hitting much of the United States, sending heating demand to three-year highs. However, weather alone doesn't create 25% moves. The real story involves pipeline maintenance restricting gas flow from major production basins like Appalachia and the Permian to high-demand urban centers. Energy analysts are now warning about potential production freeze-offs that could take as much as 10 billion cubic feet per day offline. Natural gas producers like Chesapeake Energy and EQT are dealing with this volatile pricing environment in real time.
This squeeze comes at a particularly interesting moment. The Energy Information Administration had been forecasting relatively modest natural gas prices for 2026, expecting demand growth to roughly match supply increases. Those forecasts are getting tested right now. If this cold weather persists and production issues worsen, we could see a structural repricing of natural gas futures that lasts well beyond the current weather event.
The Defensive Rotation Gains Momentum
Beneath the headline volatility, a more subtle shift is taking shape in sector performance. Utility stocks, which had underperformed for months while investors chased growth and momentum names, are showing renewed strength. This rotation into defensive sectors represents a fundamental change in investor psychology.
The utility sector historically outperforms when investors grow concerned about broader market stability. Companies like NextEra Energy and Duke Energy offer steady dividends and recession-resistant business models. When money flows into these names while simultaneously exiting growth stocks, it's often an early warning signal that larger market corrections could be developing. The pattern isn't foolproof, but it's worth monitoring closely.
Treasury Markets Send Warning Signals
Long-term Treasury bonds are displaying concerning technical patterns. TLT, the iShares 20+ Year Treasury Bond ETF, is forming a series of bear flags that typically precede further downside. What makes this particularly interesting is the geopolitical backdrop.
Denmark responded to Trump's threats by beginning to sell its U.S. Treasury holdings. Treasury Secretary Scott Bessent dismissed this as "irrelevant" and "less than $100 million," but the precedent matters more than the dollar amount. If other European countries follow Denmark's lead as a form of economic retaliation, the cumulative impact on Treasury demand could become meaningful. European leaders are meeting Thursday to discuss potential responses, including a reported $100 billion package of counter-tariffs.
Bitcoin's Safe-Haven Narrative Crumbles
The cryptocurrency market provided one of the week's clearest reality checks. Bitcoin dropped nearly 5% on Tuesday, moving in lockstep with risk assets like the Nasdaq rather than acting as the "digital gold" its proponents had promised. While actual gold and silver set new records, Bitcoin fell alongside growth stocks.
This divergence matters for how investors should think about portfolio construction. If you allocated to Bitcoin specifically for its supposed safe-haven properties during times of market stress, this week demonstrated that thesis isn't holding up. Bitcoin is trading like a speculative tech asset, not a store of value.
What Comes Next
Markets are pricing in significant uncertainty about how far these tariff threats will go. The technical setup shows oversold conditions that often lead to relief rallies, but that doesn't guarantee a bottom is in place.
The bigger question is whether this represents a temporary shakeout or the start of a sustained correction. Much depends on Europe's response over the coming weeks. When markets erase $1.2 trillion in a single day, that's a signal that risk has returned to the system, and portfolio positioning needs to reflect that reality.
Disclaimer: This article is for informational purposes only and should not be considered financial advice. Stock investing involves significant risk, including potential loss of principal. Always conduct your own research and consult with a qualified financial advisor before making investment decisions.
Recent Articles(9)
View AllWho Is Buying SpaceX at a $1.7 Trillion Valuation?
SpaceX is about to complete the largest IPO in history at a $1.7 trillion valuation, but a sum-of-the-parts analysis puts the company's intrinsic value closer to $350 to $780 billion. Here's why Starlink carries the entire business, why the price is really an AI bet, and what value investors should make of it.
NVTS Forecast 2030: Why Navitas Semiconductor Could Hit $500M (Or More)
Navitas Semiconductor (NVTS) generated $45.9 million in 2025 revenue while management targets a $3.5 billion serviceable market by 2030. Here's a probability-weighted look at where NVTS annual revenue could actually land in 2030, and why the stock has rallied nearly 1,000% in a year.

Will NVIDIA Stock Hit $300 in 2026? A Probability-Weighted Forecast
Can NVIDIA stock reach $300 by end of 2026? Three Wall Street banks say yes, with BofA at $320 and Tigress at $360. Here's the probability-weighted breakdown ahead of NVDA's Q1 FY2027 earnings on May 20.
Trump Just Disclosed Up to $750M in Q1 Stock Trades. The AI Infrastructure Pattern Is Hard to Ignore
President Trump disclosed more than 3,700 securities transactions worth up to $750 million in Q1 2026, with several buys landing one to two weeks before favorable regulatory decisions in those exact names. Here's what the AI infrastructure pattern signals for retail investors and where the second-derivative trade lives.
How to Track Smart Money: A Free Tool for Following Institutional Investors
Track 67 of the most-followed institutional investors managing $1.11 trillion in equities through SEC 13F filings. Our new free Superinvestor Tracker lets retail investors compare hedge fund and asset manager portfolios side by side without paying for a Bloomberg terminal.
Which Stock Will Be the First $6 Trillion Company?
Nvidia just closed at a $5.05 trillion market cap. Alphabet is hot on its heels at $4.80 trillion. The race to be the first $6 trillion company is closer than most retail investors realize, but the math still favors one name. Here is the realistic breakdown of who gets there first in 2026 and why.
RAM Prices Are Exploding: Inside the Great Memory Squeeze Wall Street Underestimated
DRAM contract prices surged 55-60% QoQ as AI demand permanently rewired the global memory market. Here are the top 10 memory makers by market share, which stocks win from the supercycle, and why server OEMs like Dell and HP are getting margin-crushed.
CoreWeave Just Locked In Meta and Anthropic in 48 Hours. Is CRWV a Buy in 2026?
CoreWeave locked in $21B from Meta and a multi-year Anthropic deal in 48 hours, pushing backlog to $87.8B. Is CRWV stock a buy in 2026? Here is the probability-weighted take.
How the Iran War Quietly Became the Biggest Threat to AI Infrastructure Stocks
The Iran war wasn't just an oil story, it was a stress test for AI infrastructure stocks. Here's how IREN, CoreWeave, Nebius, and Nvidia are really exposed to energy cost shocks, and which names look best positioned after the ceasefire.
About WSS Team
WallStSmart editorial team delivering professional financial analysis and market insights.
Follow on Twitter