How Market Timing Myths Cost You Money
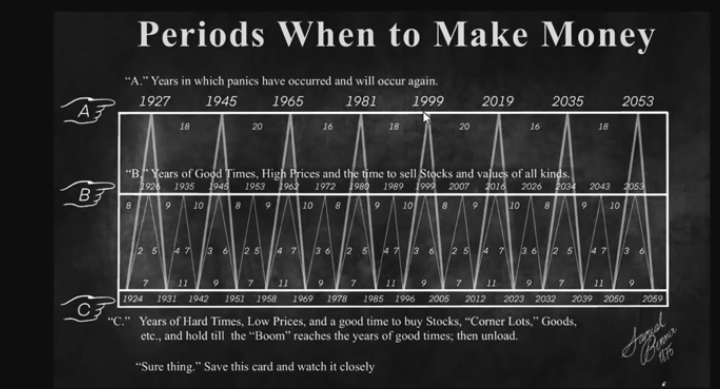
A viral chart claims to predict market crashes every 18 years like clockwork, with dates, signatures, and that "secret Wall Street wisdom" vibe. The Benner Cycle has one major problem: it's factually wrong. From missed crash dates to predicted panics that never happened, here's why market timing myths destroy returns.
Key Takeaways
- The viral Benner Cycle chart gets major crash dates wrong, including 1929, 2000, and 2019.
- Market timing destroys returns while buy-and-hold strategies in quality companies build wealth.
You've probably seen it floating around social media: a vintage-looking chart claiming to predict market crashes every 18 years like clockwork. It's got dates, a hand-drawn signature, and that "secret Wall Street wisdom" vibe that makes you want to screenshot and save it.
Here's the problem: it's completely wrong.
Not just a little off, but factually incorrect dates, missed crashes, and predicted panics that never happened. Yet thousands of investors are making real money decisions based on this garbage.
The Chart That Gets History Wrong
The chart claims 1927 was a panic year, but the actual Wall Street Crash happened in October 1929, two years later. That's like saying World War II started in 1937 instead of 1939, and if you can't get the most famous market crash in history right, why should anyone trust your predictions?
It lists 1999 as the next panic, except the dot-com bubble actually burst in March 2000. According to Goldman Sachs research, the NASDAQ peaked on March 10, 2000, then lost 78% of its value over the next two years. Companies like Amazon survived that crash, but only because of fundamentals, not because someone timed the market perfectly.
The chart predicts 2019 as a crash year, which is particularly laughable because there was no crash in 2019 whatsoever. What actually happened was the market had a rough December 2018, then recovered throughout 2019, meaning anyone who sold everything in early 2019 based on this chart missed out on solid gains.
The pattern of inaccuracy continues throughout the entire chart, with 1981 listed as a panic year when the actual recession bottomed in August 1982, and the chart completely ignoring Black Monday in October 1987 when the Dow dropped 22.6% in a single day.
Where This Theory Actually Comes From
There is a real economist named Fred Harrison who studies 18-year cycles, but here's what the viral chart doesn't tell you: Harrison's research focuses specifically on real estate and property markets, not stocks and "all values." His work analyzing 300 years of land prices found that property tends to follow roughly 18-year patterns with 14 years up and 4 years down, and he famously predicted the 2008 housing crash years in advance, which is legitimate research worth respecting.
But the chart you're seeing is actually something different: the Benner Cycle, created in 1875 by Samuel Benner, an Ohio farmer who got wiped out in the Panic of 1873. Benner studied pig iron prices, hog markets, and corn yields, then created a chart predicting "panic years," "good times," and "hard times" all the way to 2059. He even claimed it related to 11-year solar cycles affecting crop yields.
Trying to apply rigid 18-year cycles to the entire stock market is fortune-telling dressed up as analysis, because markets don't crash on schedule the way this chart suggests. They crash when underlying conditions create breaking points, which can happen at unpredictable intervals that have nothing to do with some predetermined cosmic timeline.
Why Market Timing Fails
Study after study shows that trying to time the market destroys returns, and the math behind this is absolutely brutal. If you miss just the 10 best trading days over a 20-year period, your returns get cut roughly in half, and those best days often happen right after the worst days when everyone's panicking and charts like this are telling you to sell.
Research from the Federal Reserve on the 1929 crash found that the investors who got crushed weren't the ones holding quality businesses but rather the speculators who kept trying to catch tops and bottoms. Think about companies like Microsoft or Nvidia and how their long-term shareholders didn't get rich by jumping in and out based on cycle theories but by holding through volatility, collecting the gains, and letting compound growth do the work.
What Actually Works
Instead of trying to predict unpredictable crashes, focus on what you can control by buying quality companies trading at reasonable prices, diversifying across sectors, and keeping some cash for opportunities when markets do drop. The 2008 financial crisis didn't happen because we hit year 18 of some cosmic cycle but because of overleveraged housing markets, risky mortgage securities, and regulatory failures that were visible if you knew what to look for.
Same with the dot-com crash, which wasn't about hitting a date on a calendar but about companies with zero profits trading at insane valuations because everyone thought "this time is different." Charts promising to predict the future are comforting because they make the chaos feel controllable, but they're also expensive lies that cost you real money.
Every hour you spend studying cycle theories is an hour you could spend actually analyzing businesses, understanding what you own, and building real wealth. The market will crash again, that's guaranteed, but when it happens nobody knows, and anyone claiming they do is either lying or deluded.
Your job isn't to predict the next crash but to be positioned so that when it happens, you can handle it without panicking and maybe even take advantage of the opportunities it creates. That's the real secret Wall Street doesn't want you chasing: there is no secret, just patience and discipline that compounds over time.
Disclaimer: This article is for informational purposes only and should not be considered financial advice. Stock investing involves significant risk, including potential loss of principal. Always conduct your own research and consult with a qualified financial advisor before making investment decisions.
Recent Articles(9)
View AllWho Is Buying SpaceX at a $1.7 Trillion Valuation?
SpaceX is about to complete the largest IPO in history at a $1.7 trillion valuation, but a sum-of-the-parts analysis puts the company's intrinsic value closer to $350 to $780 billion. Here's why Starlink carries the entire business, why the price is really an AI bet, and what value investors should make of it.
NVTS Forecast 2030: Why Navitas Semiconductor Could Hit $500M (Or More)
Navitas Semiconductor (NVTS) generated $45.9 million in 2025 revenue while management targets a $3.5 billion serviceable market by 2030. Here's a probability-weighted look at where NVTS annual revenue could actually land in 2030, and why the stock has rallied nearly 1,000% in a year.
Will NVIDIA Stock Hit $300 in 2026? A Probability-Weighted Forecast
Can NVIDIA stock reach $300 by end of 2026? Three Wall Street banks say yes, with BofA at $320 and Tigress at $360. Here's the probability-weighted breakdown ahead of NVDA's Q1 FY2027 earnings on May 20.
Trump Just Disclosed Up to $750M in Q1 Stock Trades. The AI Infrastructure Pattern Is Hard to Ignore
President Trump disclosed more than 3,700 securities transactions worth up to $750 million in Q1 2026, with several buys landing one to two weeks before favorable regulatory decisions in those exact names. Here's what the AI infrastructure pattern signals for retail investors and where the second-derivative trade lives.
How to Track Smart Money: A Free Tool for Following Institutional Investors
Track 67 of the most-followed institutional investors managing $1.11 trillion in equities through SEC 13F filings. Our new free Superinvestor Tracker lets retail investors compare hedge fund and asset manager portfolios side by side without paying for a Bloomberg terminal.
Which Stock Will Be the First $6 Trillion Company?
Nvidia just closed at a $5.05 trillion market cap. Alphabet is hot on its heels at $4.80 trillion. The race to be the first $6 trillion company is closer than most retail investors realize, but the math still favors one name. Here is the realistic breakdown of who gets there first in 2026 and why.
RAM Prices Are Exploding: Inside the Great Memory Squeeze Wall Street Underestimated
DRAM contract prices surged 55-60% QoQ as AI demand permanently rewired the global memory market. Here are the top 10 memory makers by market share, which stocks win from the supercycle, and why server OEMs like Dell and HP are getting margin-crushed.
CoreWeave Just Locked In Meta and Anthropic in 48 Hours. Is CRWV a Buy in 2026?
CoreWeave locked in $21B from Meta and a multi-year Anthropic deal in 48 hours, pushing backlog to $87.8B. Is CRWV stock a buy in 2026? Here is the probability-weighted take.
How the Iran War Quietly Became the Biggest Threat to AI Infrastructure Stocks
The Iran war wasn't just an oil story, it was a stress test for AI infrastructure stocks. Here's how IREN, CoreWeave, Nebius, and Nvidia are really exposed to energy cost shocks, and which names look best positioned after the ceasefire.
About WSS Team
WallStSmart editorial team delivering professional financial analysis and market insights.
Follow on Twitter